How the customer views our organization is crucial in their decision making process. Sure, we train our staff to we answer the phone quickly, we always speak with a smile in our voice, our sales people are gregarious and polite, our products work they way they were designed, and we do our best to correct any problems.
Those things are important, but that is not enough to insure that our customers keep coming back to do business with us. We need to know in measurable terms what the customer thinks when our name comes up. We need to develop as accurate a picture as possible of how our customers see our performance.
In Topic 1, we discovered what our customers wanted from our product or service. In this topic we are going to discover what our customers think of how we deliver. I’m not talking about the kinds of vehicles we use; I’m talking about the ability to deliver an order from the first inquiry until it’s in their hands.
When I talk about customer perception with executive teams, I start by asking the following;
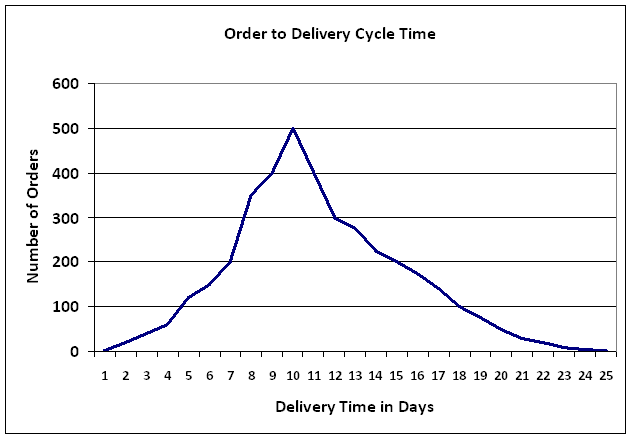
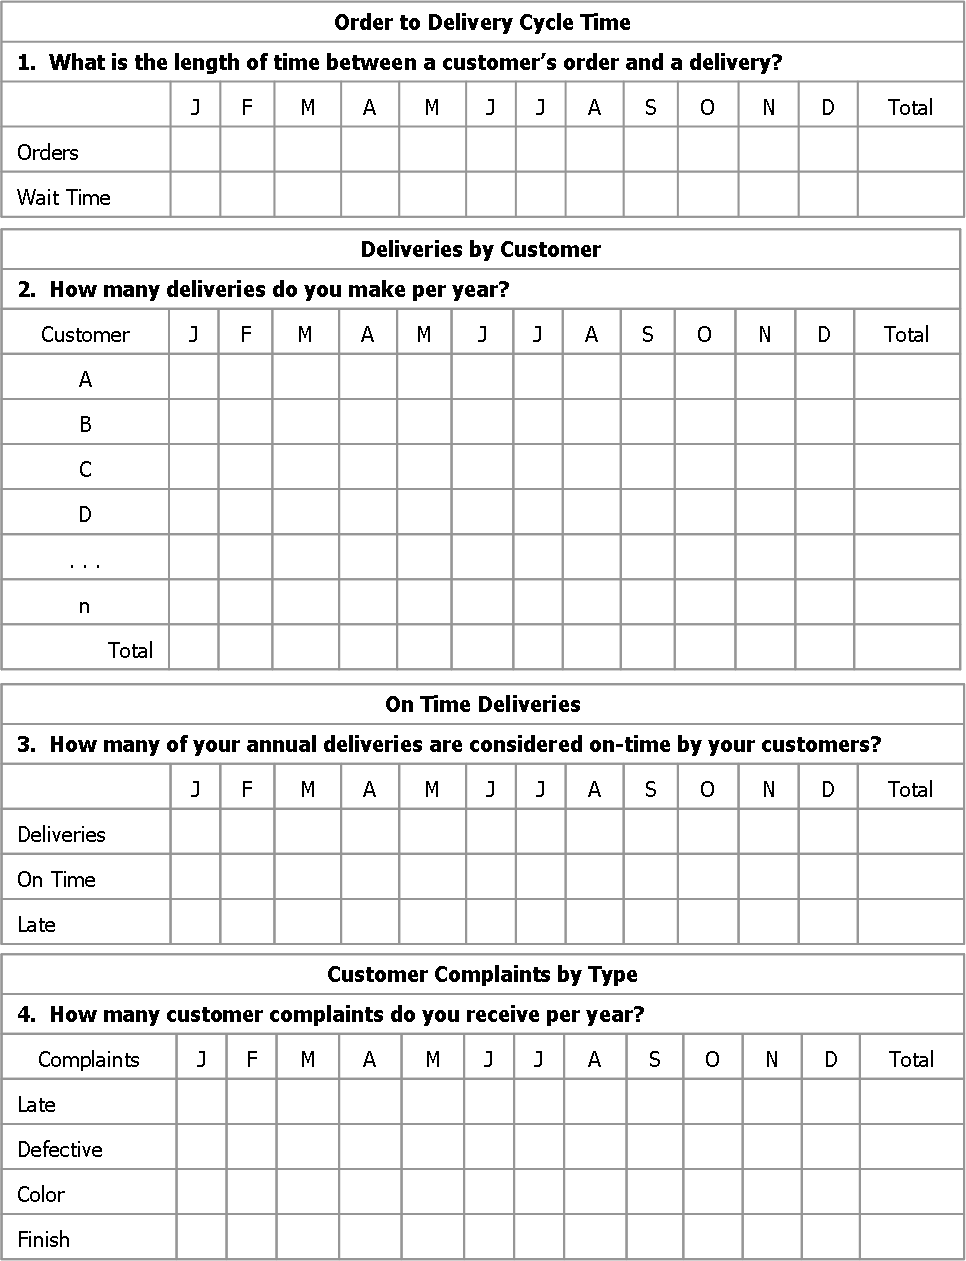
- What is the length of time between a customer’s order and a delivery?
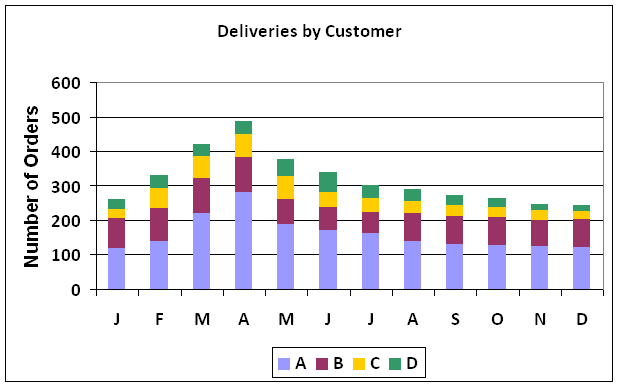
- How many deliveries do you make per year?
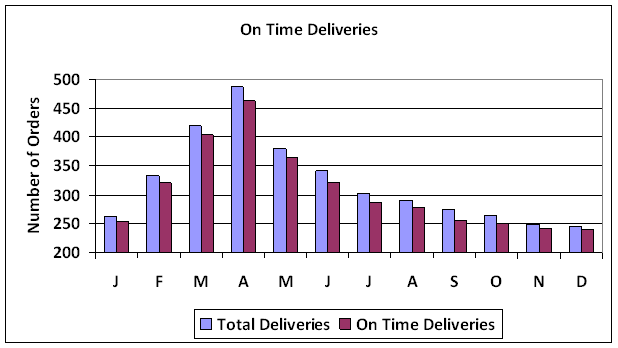
- How many of your annual deliveries are considered on-time by your customers?
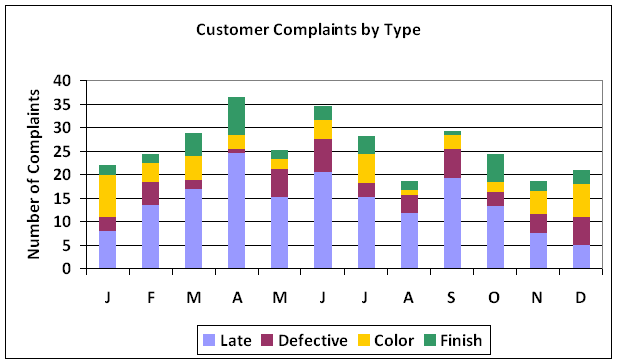
- How many customer complaints do you receive per year?
These questions get to the experience a customer has with your company. A customer’s experience is the total of the various interactions between a buyer and an organization. Loyalty is hard to get and even harder to keep. A problem during a single interaction; in a string of interactions from order to delivery, can damage hard won loyalty.
Once you’ve collected the data that answers these 4 questions you should have the following list of charts:
- Order to Delivery Cycle Time in Days
- Deliveries by Customer by Month
- On Time Deliveries by Month
- Customer Complaints by Type by Month
From this list of charts you can put together your Customer Perception Dashboard, similar to charts below.
Customer Perception Dashboard Charts:
1. Order to Delivery Cycle Time
2. Deliveries by Customer
3. On Time Deliveries
4. Customer Complaints by Type
Ideally you will have five years worth of data, but if you don’t that’s okay. Even one year’s worth of data will be a good starting point. You might ask here; what if I don’t have any of this data? In that case, you need to start collecting data and using what you have after a few weeks.
Here is an example of some spreadsheet formats for questions 1 – 4, to get you going.
In the next post of the Business Performance Measurement Series; I will discuss Topic 3. Process Speed. Your processes are where your customers can see your performance. In fact, your company’s processes are perfectly designed to get the results you are currently getting.

