You’ve been following the Business Performance Measurement Series and now have a set of charts and tables filled in that are based on your company’s current performance.
Up to this point we’ve covered the following topics:
Topic 1. Customer Knowledge
Topic 2. Customer Perception
Topic 3. Process Speed
Topic 4. Inventory
Topic 5. Quality
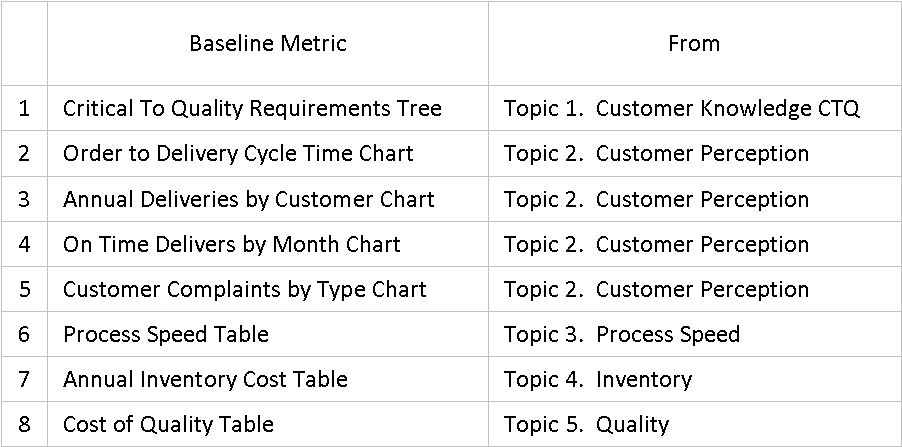
From those 5 topics we’ve derived 8 baseline metrics. With these 8 metrics we know where we stand with our customers, the speed of our processes, the impact that our inventory levels are having on our balance sheet, and how much money we are spending on quality.
I think it’s important to mention that I’m not suggesting we minimize the amount of money that we spend on defect prevention. Also I don’t want to suggest that the more money that is spent on quality, the better off you’ll be with your customers.
What we’re trying to determine is; do our processes provide the value the customer is looking for? Once our processes are optimized to meet the Critical To Quality requirements, then we know we are spending the right amount of money.
The 8 Baseline Metrics
What we’ve done is get to the heart of what drives your company’s ability to out perform your competition. If you’ve been measuring your operational performance for a few years and have created a culture of continuous improvement; then you probably have already implemented innovative processes that your customers find valuable.
For those of you who are beginning the journey of continuous improvement, then these 8 baseline metrics form the core of understanding where to start reducing non-value added activities.
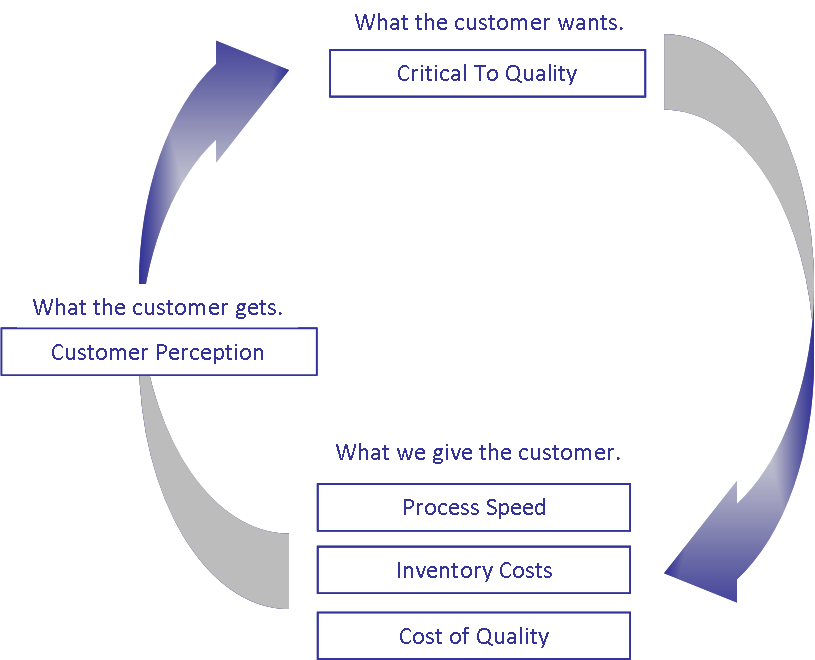
The following graphic summarizes the relationship between what the customer wants and how we’re performing against those expectations.
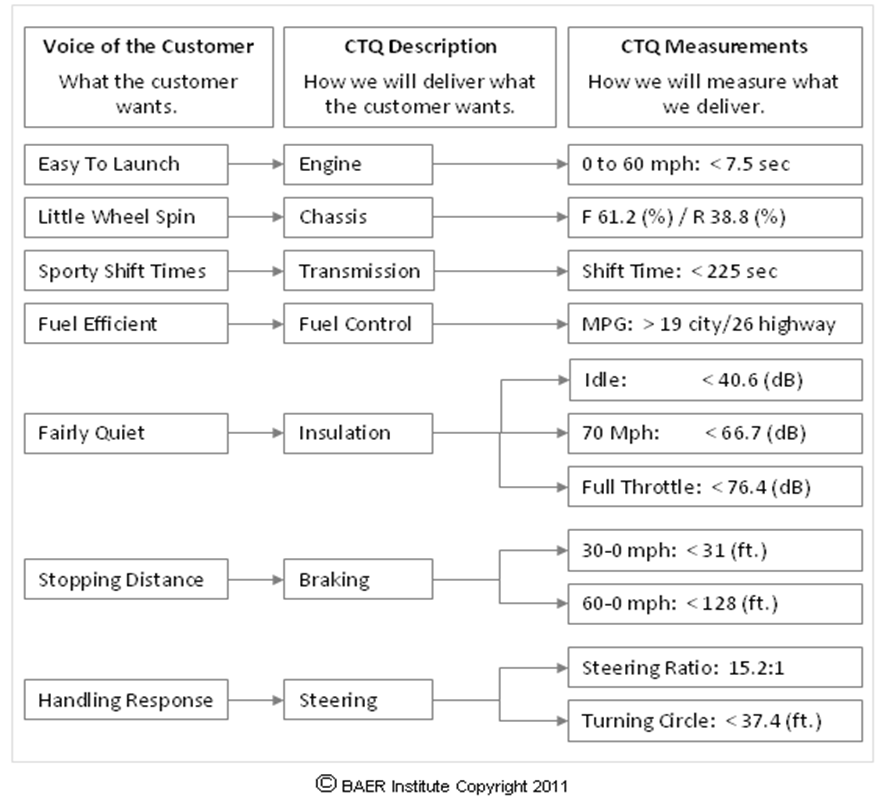
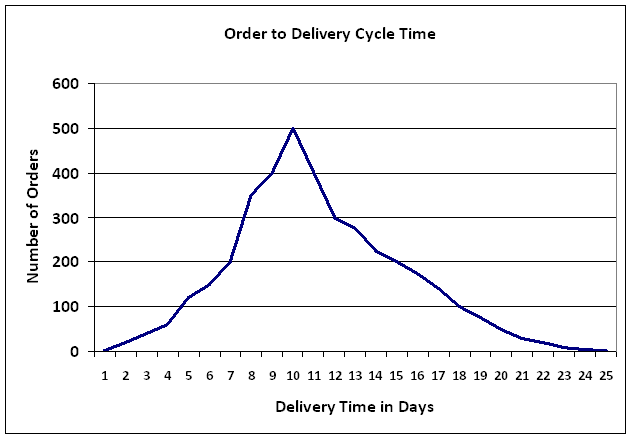
Below are sample charts and tables for the 8 baseline metrics.
Metric 1. Critical To Quality Requirements Tree
Metric 2. Order to Delivery Cycle Time Chart
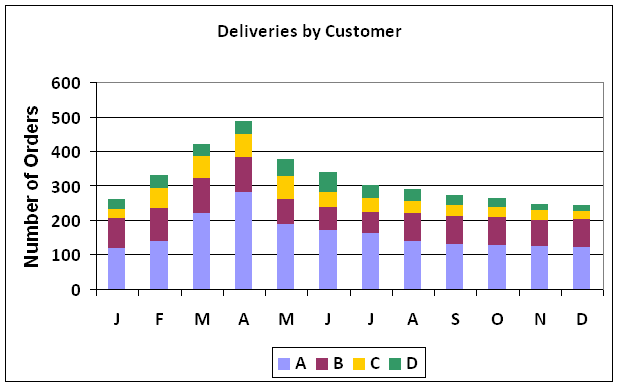
Metric 3. Annual Deliveries by Customer Chart
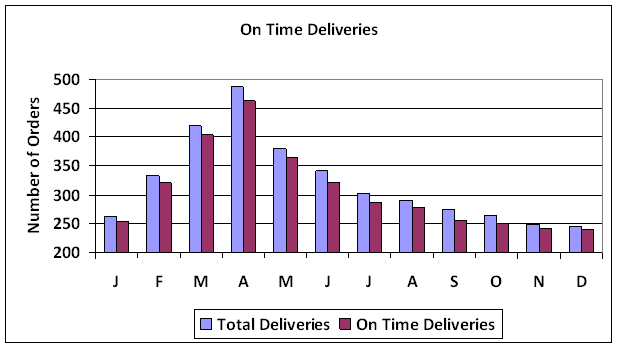
Metric 4. On Time Deliveries by Month Chart
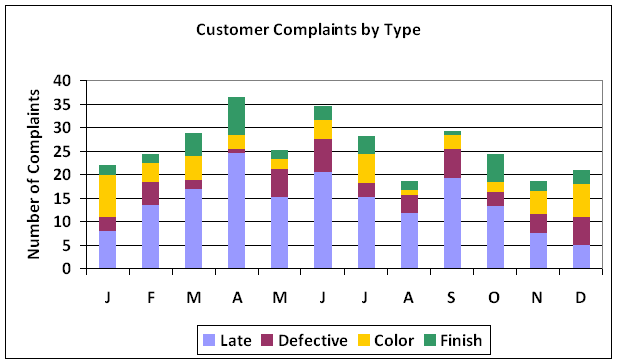
Metric 5. Customer Complaints by Type Chart
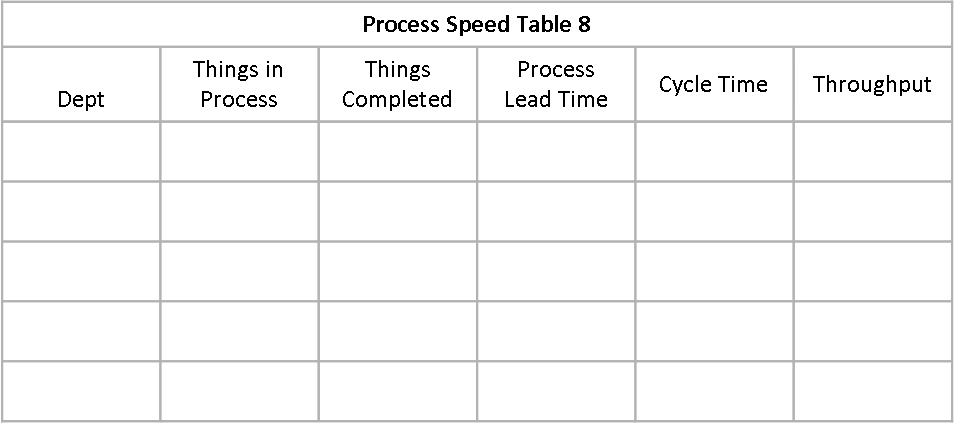
Metric 6. Process Speed Table
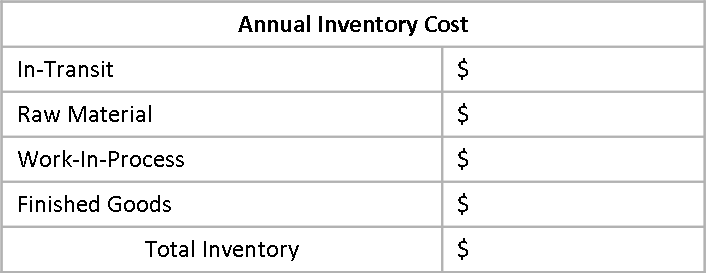
Metric 7. Annual Inventory Cost Table
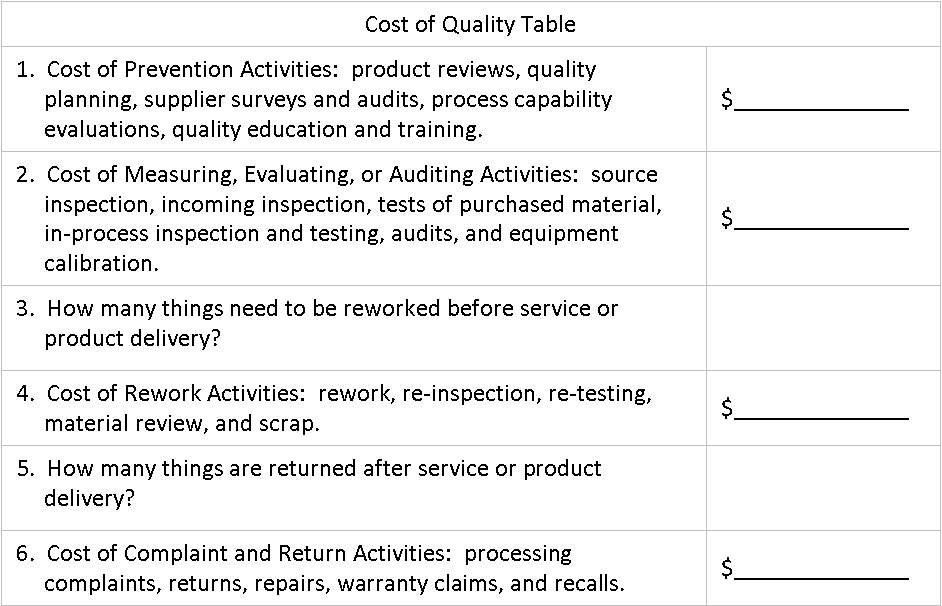
Metric 8. Cost of Quality Table
Now that you’ve collected the data and used the charts and tables to analyze your current performance, we’ll move to the next step; which is to determine how much cash you can free up to fund your revenue growth. We’ll cover that in the next post.

