We discussed in the previous post Topic 4. Inventory, how slow processes lead to excess inventory. Now we are going to talk about Topic 5. Quality, how high quality processes have low variation and low quality processes have high variation.
Processes with a lot of variation are slow processes. We can see variation in all parts of the business; product development, service development, customer service, order fulfillment, raw materials, production, lead times, and cycle times.
Quality experts may disagree somewhat on a precise definition of quality. If you want to see a list, check out the Definition section of the “Quality (business)” article on Wikipedia. This is the one I like to use; quality is the variation that a customer sees in what they bought.
Why is variation important? Customers are constantly evaluating our products, services, and processes to decide how well we are meeting their expectations and whether they wish to continue to do business with us.
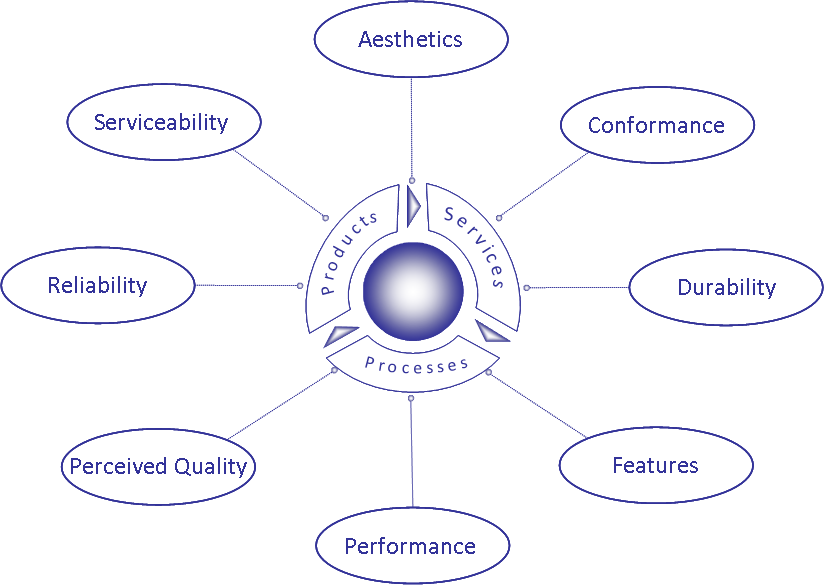
Variation is the source of defects in our products and processes. Which leads to the question; what aspects of variation do our customers evaluate? Most quality practitioners would agree on the following list:
There may be other aspects of variation that are specific to your industry, but these 8 help us understand how customers think about what we offer. Your company’s products or services are the result of your processes.
Improvements in meeting customer expectations, translates into reducing process variation. The reduction of process errors, product defects, and late deliveries can free up the cash needed to grow your revenue and profits.
Where am I burning cash on process variation? You can find out by asking your executive team the following 6 questions:
- How much do we spend on activities designed to prevent poor quality in products or services?
- How much do we spend measuring, evaluating, or auditing activities to assure that your products or services meet your customer’s requirements?
- How many things need to be reworked before service or product delivery?
- How much do we spend on activities resulting from your products or services not meeting your customer’s requirements prior to delivery?
- How many things are returned after service or product delivery?
- How much do we spend on activities resulting from your products or services not meeting your customer’s requirements after delivery?
We’ll examine each of these questions in more detail and give your team the chance to calculate how much money you have tied up in non-value added activities.
1. How much do you spend on activities designed to prevent poor quality in products or services?
Prevention activities include: product reviews, quality planning, supplier surveys and audits, process capability evaluations, quality education and training.
2. How much do you spend measuring, evaluating, or auditing activities to assure that your products or services meet your customer’s requirements?
Measuring, evaluating, or activities include: source inspection, incoming inspection, tests of purchased material, in-process inspection and testing, audits, and equipment calibration.
3. How many things need to be reworked before service or product delivery?
4. How much do you spend on activities resulting from your products or services not meeting your customer’s requirements prior to delivery?
Rework activities include: rework, re-inspection, re-testing, material review, and scrap.
5. How many things are returned after service or product delivery?
6. How much do you spend on activities resulting from your products or services not meeting your customer’s requirements after delivery?
Complaint and return activities include: processing complaints, returns, repairs, warranty claims, and recalls.
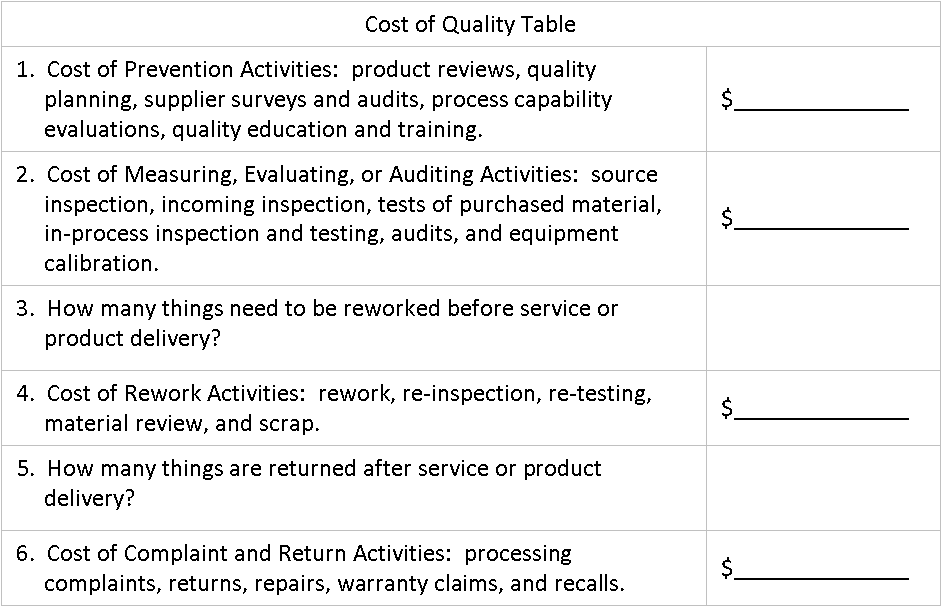
Fill out the Cost of Quality Table to see how much cash you have tied up in defect prevention.
In the next post Topic 6. Baseline Metrics, we’ll merge the data from Process Speed, Inventory, and Quality; so that we can figure out where to begin to free up the cash that you’re spending on non-value added activities.


