In Topic 2. Customer Perception, we concluded with the idea that; your processes are where your customers can see your performance. In fact, your company’s processes are perfectly designed to get the results you are currently getting.
For this topic, Process Speed we’ll start by talking about what does speed mean in a process. We can begin to think about this by imagining an item; a request, a piece of paper, a bit of information, or a piece of hardware. Now ask yourself; how fast (or how slow) does the item go through my process. That is the process speed.
If your company is performing at a high level, then perfectly designed processes to get superior results is a positive consequence of your efforts. Companies don’t deliberately design their business processes to go slow. What happens is that over time what were possibly above average processes deteriorated when no one was looking.
If you haven’t evaluated your processes in a while; then you will probably find that you have accumulated many process steps that are irrelevant, obsolete, or redundant and are no longer adding value. If it’s been more than 2 years since you’ve designed innovative processes then you are leaving a lot of cash on the table.
Here’s how to evaluate your processes to find out if you are getting the value you expect or that your customer’s expect? We start by asking the following questions:
- What does your organization call the stuff, or items, or things you work on?
- How many things are in process per minute, per hour, per day, or per week?
- How many things are completed each minute, hour, day, or week?
Answering these questions will help your company determine where your process is slowing down. At this point we’re trying to figure out; how much value or lack of value do my processes add to the bottom line.
Let’s look at the first question.
1. What does your organization call the stuff or things you work on?
Some examples are: orders, units, tasks, activities, reports, emails, inquiries, calls, requests, notices, events, items, or (whatever). What word or words do you use to describe the output of each department.
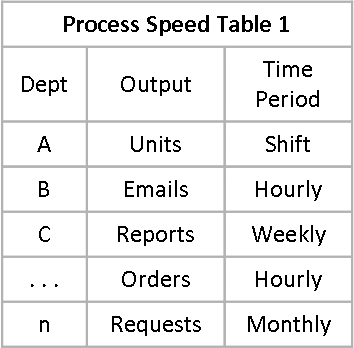
It is common for department’s to have different names for what they do. For example, Procurement processes orders, Accounting processes reports or data, and Shipping processes units. After you’ve named the output, decide for each department what time period is used to measure their output. Each department will likely have different time periods.
Once you’ve named the output of each department and the department’s time period, you should have a table that looks something like this:
Now let’s work with the second question.
2. How many things are in process per minute, per hour, per day, or per week?
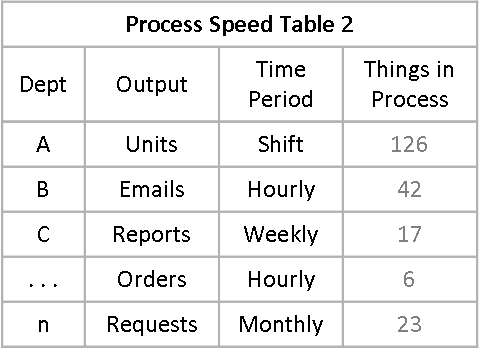
For each department count the average number of things in work per time period. If this is the first time you are doing this, don’t worry about being 100% accurate. An estimate that is around 80% – 90% of the actual is good enough for right now. You can get closer to 100% over time.
I’ll put in some numbers for the remaining tables so you can see how the calculations are made.
So now your table should look like this.
We’re almost through. The last question is:
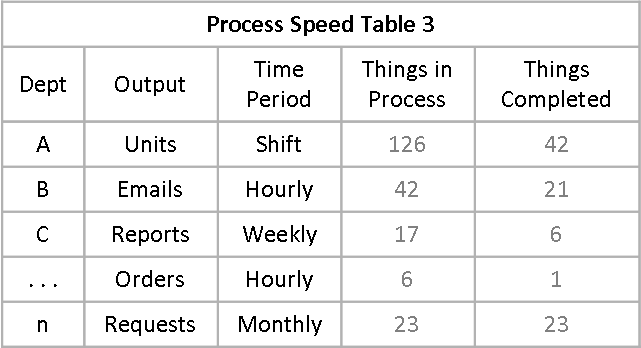
3. How many things are completed each minute, hour, day, or week?
For each department count the average number of things completed per time period. Again, an estimate that is around 90% of the actual is good enough for right now. Your table now looks like this.
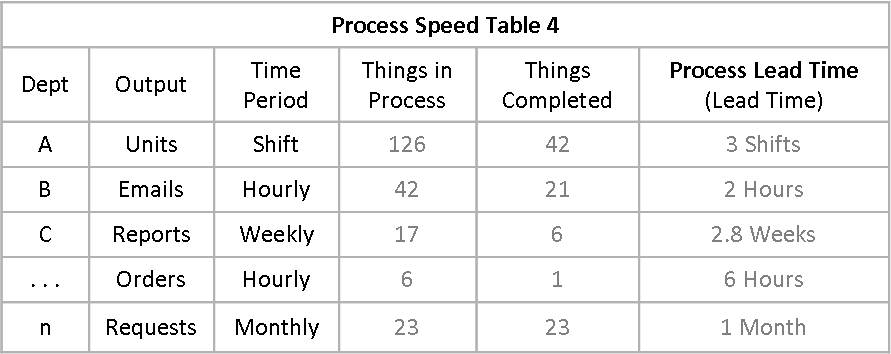
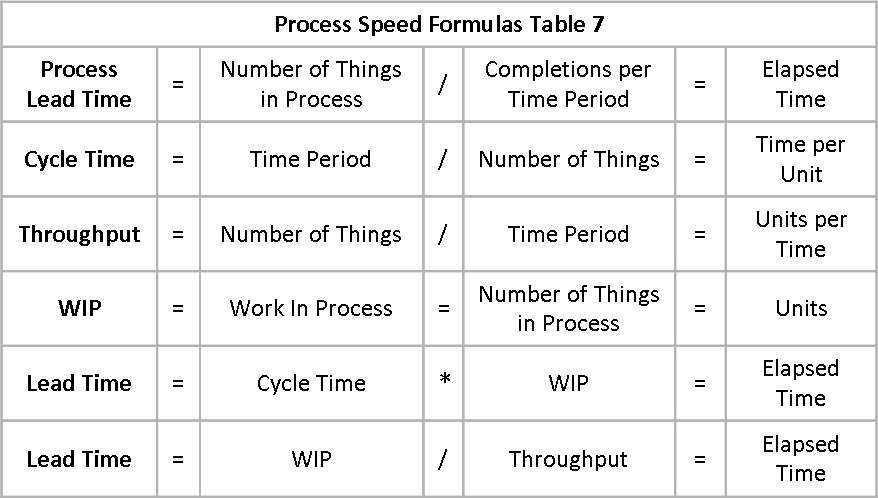
The Process Lead Time column in the table below is calculated using the following formula:
Which makes sense; if I have 126 things to do and it takes me an average of 1 eight hour shift to finish 42, then I have a 3 shift lead time (126 divided by 42 = 3), before I can start on another new thing.
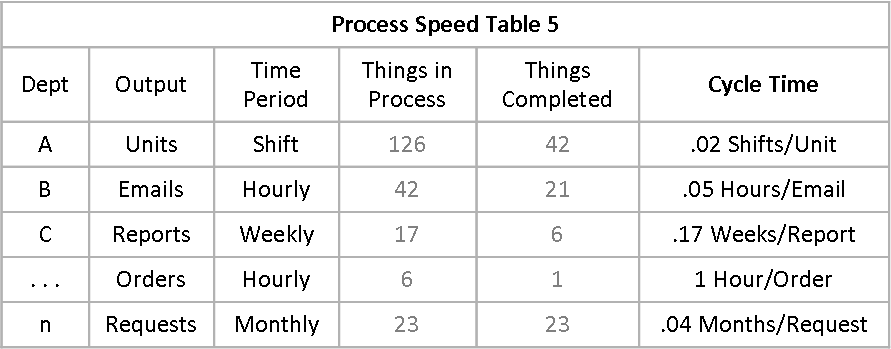
We can also compare Process Lead Time (or Lead Time) to Cycle Time and Throughput. These are the measurements we will use to evaluate if our processes are getting faster and eliminating non-value added activities. The following chart compares Lead Time (last column) in the table above with Cycle Time in the table below. Cycle Time is calculated using the following formula:
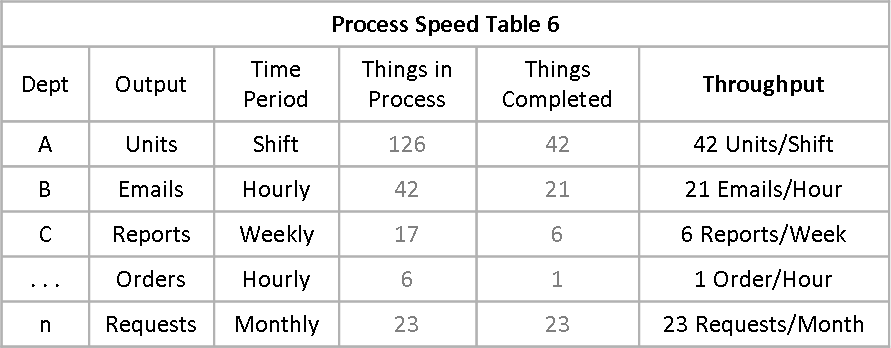
The table below compares Throughput (last column) with Cycle Time and Lead Time.
Throughput is calculated using the following formula:
In understanding Process Speed we’ve introduced the concepts of Lead Time, Cycle Time, Work-In-Process, and Throughput. We can also use these concepts to look for time traps, a technique to reduce inventory as well as increase process speed.
We’ve also worked with the following terminology and formulas.
It is not important to memorize these formulas. What I would like for you to do at this point is be aware that Lead Time, Cycle Time, Throughput, and WIP have different meanings. Also, you can see that the math is easy; it’s just multiplying and dividing.
Later when we apply these concepts it will become obvious how they are used. So don’t get hung up over the math.
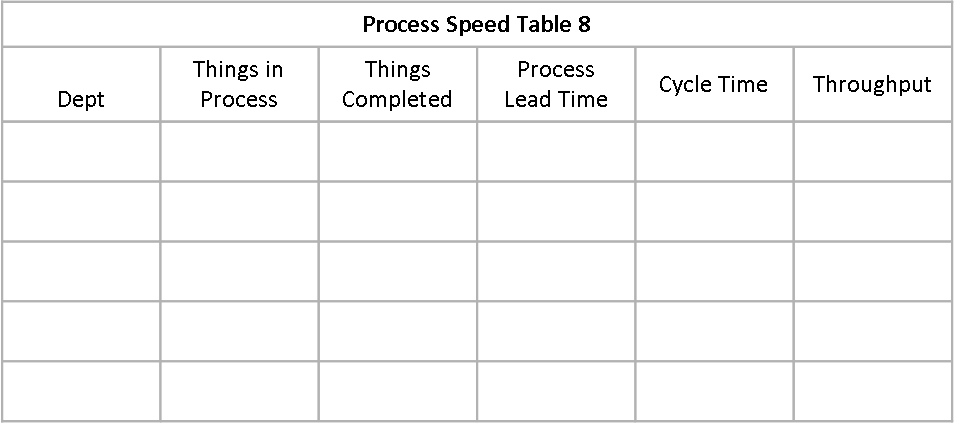
Below is a sample table to help you set up your data.
In the next post of the Business Performance Measurement Series; I will discuss Topic 4. Inventory. Slow processes are wasteful processes. And slow processes lead to excess inventory. Even though accountants label inventory on the Balance Sheet as an asset, don’t be fooled. Don’t think that you can go to the Inventory Bank and pull out your money. For every dollar on the books you won’t be able to get a dollar in hand.

